
How ATM Cash Forecasting Works: A Practical Guide
Posted on:
September 11, 2026
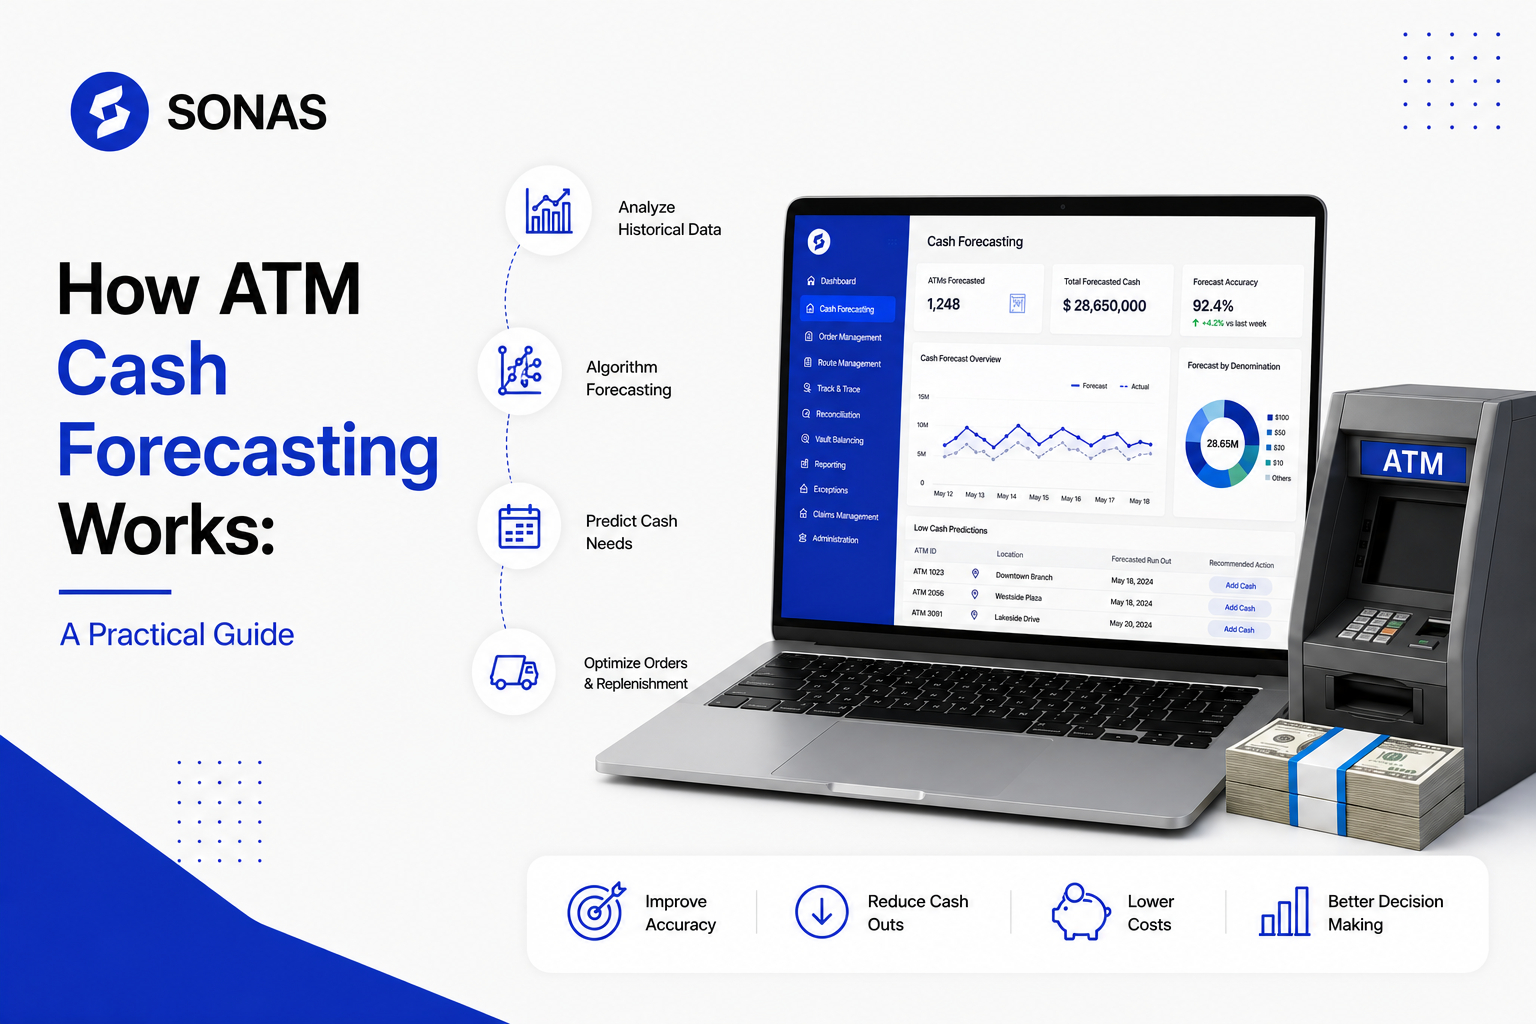
Quick Answer: ATM cash forecasting analyses historical withdrawals, current cash levels, and demand drivers such as paydays, holidays, and local events to estimate how much cash each ATM will need before its next service visit. The forecast then informs replenishment timing and load amounts, helping operators reduce cash-outs, limit idle cash, and plan cash-in-transit activity more efficiently.
Every time a customer walks up to an ATM and sees “out of service,” your institution absorbs a cost. The lost transaction revenue is immediate, while repeated cash-outs also damage customer trust and create additional work for operations teams.
Loading every ATM with more cash than it needs creates a different problem. Capital remains unused inside the machines, while cash handling and replenishment costs increase across the network. Finding the right balance becomes difficult when demand changes by location, day of the week, salary cycle, season, and local activity.
ATM cash forecasting brings these variables together to estimate future withdrawals at the device level. This guide explains how the forecasting process works, how forecasts become replenishment orders, and how teams can measure and improve its performance.
What Is ATM Cash Forecasting?
ATM cash forecasting, also called cash demand forecasting, is the process of estimating how much cash an individual ATM will dispense over a future period. The forecast uses historical transaction data, current balances, and relevant demand signals to calculate how much cash the machine is likely to require before its next planned service.
The output should answer two practical questions: when does the ATM need to be replenished, and how much cash should be loaded?
The answer varies by machine. An ATM at a transport hub often shows sharp weekday peaks, while a rural branch ATM often follows a steadier pattern. Applying one fixed amount across an entire network ignores these device-level differences.
A complete forecasting workflow connects three activities:
● Transaction data analysis: Reviewing withdrawals, values, times, dates, and denominations at ATM level.
● Balance monitoring: Tracking how much cash remains and identifying machines depleting faster than expected.
● Replenishment planning: Converting forecast demand into a recommended service date and load amount.
Together, these activities move ATM cash management away from fixed assumptions and towards decisions based on current and expected demand.
Why ATM Cash Forecasting Matters
Forecasting affects customer access, cash utilisation, logistics costs and wider network planning. Its value comes from maintaining sufficient cash to meet demand while avoiding unnecessary holdings and service activities.
Here are the four main ways accurate ATM cash forecasting improves network performance:
Reduce Cash-Outs and Protect Service Uptime
A cash-out prevents customers from withdrawing money and leads to complaints, lost transaction revenue and additional service work. Accurate forecasts identify how much demand is expected before the next replenishment, giving operations teams time to adjust the load or bring a visit forward when necessary.
Live balance monitoring strengthens this process. A forecast provides the expected demand path, while current balance data shows whether the ATM is following it. When actual withdrawals rise faster than predicted, the team can treat the machine as an exception before it runs out.
Improve Cash Utilisation
Cash held inside an ATM is unavailable for other uses until it is withdrawn or returned. Repeatedly overloading machines therefore reduces cash utilisation across the network, especially when the same fixed amount is assigned to ATMs with very different demand profiles.
Cash demand forecasting estimates the amount required for each service period. The aim is to maintain an appropriate buffer without loading substantially more cash than the ATM is expected to dispense.
Control Cash-in-Transit Costs
Every cash-in-transit, or CIT, visit involves transport, labour, security and processing costs. Fixed schedules can send a crew to a machine that still holds sufficient cash, while weak forecasts create emergency visits when demand exceeds the planned load.
Better replenishment planning helps teams align service activity with predicted need. It also supports more stable cash ordering, route planning, and coordination with external CIT partners.
Improve Planning Across the Network
Reliable ATM-level forecasts provide useful information beyond the individual machine. Treasury teams gain a clearer view of expected cash requirements, vault teams can prepare orders with greater confidence, and operational managers can identify locations that regularly require intervention.
This visibility also makes performance problems easier to diagnose. A high cash-out rate often points to weak forecasts, delayed execution, poor data, or an unsuitable service schedule. Treating these causes separately leads to more effective corrective action.
How ATM Cash Forecasting Works
ATM cash forecasting follows a continuous cycle. It uses past ATM activity, current cash positions, and expected demand changes to calculate how much cash each machine requires before its next service. Here is how the process works, from collecting transaction data to reviewing the accuracy of each forecast:
1. Collect Historical Transaction Data
The process begins with device-level transaction records. Useful fields include the amount dispensed, transaction time, date, denomination, and ATM identifier. Current cash balances, replenishment history, cash-out records, and service interruptions also provide important context.
Data quality matters because recorded withdrawals do not always equal true demand. When an ATM is empty or unavailable, customers cannot complete withdrawals, so the transaction record can understate what they would otherwise have requested. Research published in the International Journal of Forecasting identifies cash-out days as an important feature to account for when developing ATM stocking forecasts.
Historical data should therefore be checked for gaps, duplicate records, system migrations, unusual values, and periods when the machine was unavailable. These records should be flagged, corrected or treated separately before modelling begins.
2. Identify Withdrawal Patterns
The next stage looks for recurring behaviour in each ATM's history. Common patterns include:
● Day-of-week differences between weekdays and weekends
● Intra-month peaks linked to salary or benefit payment dates
● Seasonal changes across holidays, tourism periods and retail cycles
● Location-specific demand linked to surrounding activity
● Differences in denomination use and cassette depletion
ATM demand is rarely uniform across a network. Research comparing forecasting methods has found that accessibility, surrounding environment and ATM grouping influence withdrawal patterns and model performance. Segmenting machines with similar characteristics can improve forecasting compared with applying one network-wide rule.
3. Add External Demand Variables
Historical withdrawals form the baseline, but known future events can shift demand away from that baseline. Relevant variables include public holidays, local festivals, sporting events, tourism peaks, salary dates and planned outages in nearby machines.
A study using withdrawal data from 111 UK ATMs found that adding special-day information improved forecasts produced by an exponential smoothing model. The wider lesson is that better input data can improve forecasting even when the underlying method remains relatively simple.
External variables should be selected carefully. A national holiday affects a retail ATM differently from a machine inside an office building. The forecast should reflect the location and the way customers use that particular device.
4. Apply a Forecasting Method
Once the data is prepared, a forecasting method estimates future withdrawals. The best approach depends on data quality, demand stability, network complexity, forecast horizon, and the organisation's ability to maintain the model.
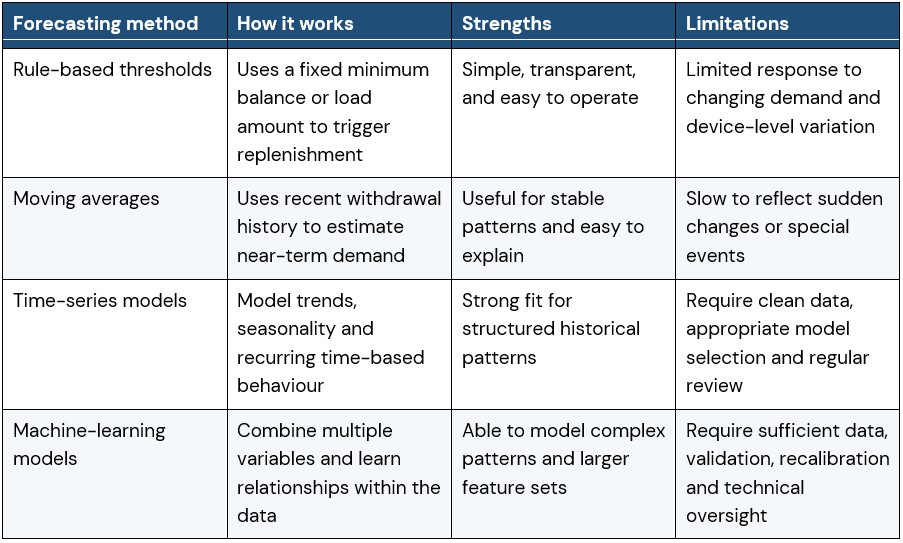
Advanced models do not remove the need for sound data and evaluation. Studies comparing statistical, machine-learning and deep-learning methods show that performance changes across datasets and market conditions. The most suitable model is the one that produces reliable operational results for the network being managed.
5. Generate Replenishment Recommendations
The demand forecast must then be translated into an operational decision. For each ATM, the calculation considers expected withdrawals, current cash, the next available service date, the desired safety buffer, and any operational constraints. The result is a recommended load amount or replenishment date.
Depending on the organisation's controls, that recommendation is either reviewed by an analyst or converted directly into an order. The order then moves into the operational workflow for approval, cash preparation, scheduling and fulfilment.
For example, an ATM near a shopping centre usually dispenses £8,000 between Friday and Monday. A public holiday and a local event are expected to increase footfall, while the machine already holds £2,500. The forecast adjusts expected demand, accounts for the current balance and recommends the amount required to remain available until the next service visit.
The figures are illustrative, but the same logic applies across the network.
6. Compare Forecasts With Actual Demand
Forecasting is an ongoing control process. After the service period ends, predicted demand should be compared with actual withdrawals. The difference shows where the model performed well and where it needs recalibration.
Real-time monitoring adds another layer of control. It identifies machines whose balances are moving outside the expected range, allowing teams to respond before the next scheduled review. Performance analysis should also distinguish between forecast error and execution failure. A correct recommendation followed by a late or incomplete replenishment is an operational issue rather than a modelling issue.
Most Common Challenges That Reduce Forecasting Accuracy
Forecasting performance depends on more than the model used to calculate demand. Poor data, outdated assumptions, unexpected events, and delays between forecasting and replenishment all affect the final outcome.
Here are the main challenges that reduce forecasting accuracy and prevent reliable recommendations from becoming successful replenishments:
Over-Relianceon Manual Spreadsheets
Spreadsheets are familiar and flexible, but manual workflows become difficult to maintain as data volumes and ATM numbers grow. Analysts spend significant time importing files, checking formulas, updating assumptions, and creating orders. Version control and key-person dependency also increase operational risk.
Excel itself is not the problem. The limitation lies in a process that depends on repeated manual updates, disconnected data, and fixed rules that do not respond quickly to current conditions.
Poorly Calibrated or Outdated Models
A model reflects the data and conditions used to build it. Changes in customer behaviour, ATM locations, local activity or service arrangements reduce its accuracy over time. A model trained on an earlier operating environment should be reviewed when forecast error begins to rise, or demand patterns change materially.
Recalibration should be based on evidence. Switching to a more complicated model will not solve a problem caused by incomplete data or delayed replenishment.
Incomplete orInconsistent Data
Missing transaction records, inconsistent ATM identifiers and unflagged outage periods distort the demand history. Data from different processors or service partners often arrives in incompatible formats, making device-level analysis harder.
A data audit should confirm that the forecasting system receives complete, timely and consistent inputs. Clear ownership is needed for resolving gaps rather than allowing them to pass silently into the model.
Exceptional Events
Forecasts are strongest when future conditions resemble patterns represented in the data. Severe weather, sudden economic disruption, major local events, and outages across nearby machines create demand that the model has not seen before.
These situations require an exception process. Analysts should be able to adjust assumptions, record the reason for an override, and review the outcome afterwards. The objective is controlled human intervention supported by data.
A Disconnect Between Forecasting and Execution
A forecast only creates value when it reaches the teams responsible for ordering and replenishment. Manual hand-offs, approval delays, route constraints, or incomplete cash preparation prevent an accurate recommendation from being fulfilled on time.
Forecast and execution metrics should therefore be reviewed separately. This helps teams identify whether a cash-out came from the demand estimate, the order, the route or the service activity.
How to Measure ATM Cash Forecasting Performance
No single metric provides a complete view. Forecast accuracy should be considered alongside service availability, idle cash and fulfilment performance.
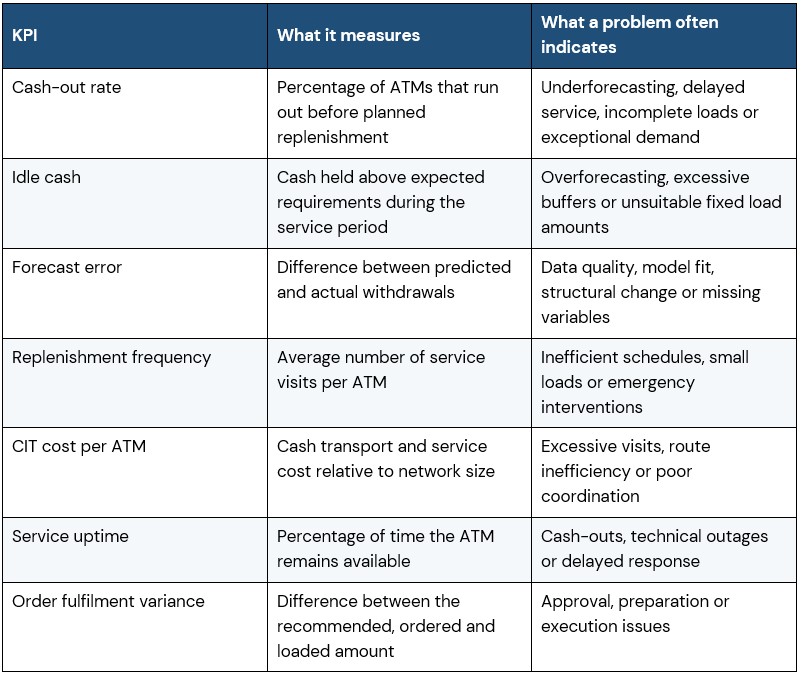
Mean Absolute Percentage Error, or MAPE, is commonly used because it expresses the average error as a percentage. It should be interpreted carefully when actual withdrawals are very low or zero, and it is best reviewed with operational metrics rather than used alone.
Teams should monitor performance by ATM, location type, and service period. A network average can hide a small group of machines that account for most cash-outs or excess holdings.
Best Practices for Improving Forecasting Accuracy
Improving forecasting accuracy requires a reliable process across data collection, demand modelling, operational review and replenishment execution. The following best practices help teams strengthen each part of that process without introducing unnecessary complexity:
Build a Reliable Data Foundation
Set clear standards for transaction, balance, replenishment and outage data. Automate data transfer where possible, use consistent ATM identifiers and flag periods when recorded withdrawals do not represent true demand.
Regular data-quality checks should identify missing files, unusual values and breaks caused by system changes. Fixing these issues early prevents them from affecting every forecast that follows.
Refresh Forecasts in Line With Operations
Forecast frequency should match the replenishment cycle and the volatility of each ATM. Stable locations often require fewer adjustments, while high-volume or event-sensitive machines benefit from more frequent recalculation and live balance monitoring.
Known holidays, local events, and temporary closures should be added before orders are finalised. Forecasts should also be reviewed after material changes in customer behaviour or service arrangements.
Segment and Back-Test the Network
Group ATMs where shared characteristics improve model performance, while retaining device-level recommendations. Useful segments include location type, accessibility, transaction volume, demand stability and surrounding activity.
Back-testing compares a model's predictions with historical outcomes that were not used to fit it. This shows how the method would have performed before it is relied upon for live replenishment decisions.
Keep Human Overrides Controlled and Visible
Experienced analysts add value when unusual conditions require judgement. Overrides should include a reason, the original recommendation, the revised amount, and the final outcome. This creates an audit trail and helps determine whether similar situations should be incorporated into future forecasts.
Regular review of overrides also prevents manual adjustments from becoming an undocumented parallel process.
Assign Clear Ownership
One team or role should own forecasting performance, data issues, model reviews and KPI reporting. Ownership can sit within treasury, cash management or ATM operations, but responsibilities should be explicit.
Scheduled reviews should examine cash-outs, idle cash, forecast error and fulfilment variance together. This keeps the focus on the full forecasting-to-replenishment workflow rather than one isolated metric.
What to Look for in an ATM Cash Forecasting Platform
A forecasting platform should turn data into decisions that operations teams can use. Model sophistication matters only when it improves reliability, visibility and execution.
Key evaluation questions include:
● Does the platform forecast demand at the individual ATM level?
● Can it use historical withdrawals, current balances and relevant external variables?
● Does it support fixed schedules, dynamic thresholds and exceptional events?
● Can users review, adjust and audit forecast recommendations?
● Does the forecast connect directly with replenishment order creation?
● Can the system monitor live balances and flag exceptions?
● Does it report forecast, cash-out, utilisation and fulfilment performance?
● Can it integrate with existing device data, operational files and service partners?
Sonas Cash Forecasting combines ATM-level demand prediction, real-time cash visibility, fixed and dynamic replenishment planning, and holiday or event adjustments. Forecast recommendations can connect with Sonas Order Management to create and manage replenishment orders, while Reporting & Analytics provides visibility into cash performance, exceptions, and service activity.
Build a Smarter Approach to ATM Cash Forecasting
ATM cash forecasting connects transaction data with daily operational decisions. When the process is well managed, each ATM receives a load based on its expected demand, current balance and next service date. Teams gain a clearer view of cash requirements, reduce avoidable cash-outs and identify where excess cash or service activity is increasing cost.
The most useful starting point is to review the current workflow from data collection through to fulfilment. Check how forecasts are calculated, how exceptions are approved, how orders reach CIT partners and whether forecast errors are separated from execution failures.
Book a demo with Sonas to see how Cash Forecasting and Order Management work together, or download the Financial Institutions brochure for an overview of the wider platform.
Frequently Asked Questions
How Much Historical Data Is Needed for ATM Cash Forecasting?
There is no universal minimum. Use enough clean data to capture weekly, monthly, and seasonal patterns. A full year is useful where available, although recent structural changes call for shorter windows or greater weight on newer transactions.
How Should Cash-Out and Outage Days Be Handled in the Data?
Flag these periods before modelling because recorded withdrawals can understate true demand. Depending on the method, the data should be excluded, adjusted, or treated as a separate condition rather than accepted as normal activity.
What Is the Difference Between Fixed and Dynamic Replenishment?
Fixed replenishment follows a planned service schedule. Dynamic replenishment responds to forecast demand, current balances, or threshold conditions. Many networks use both, keeping predictable visits while adjusting orders when an ATM moves outside its expected demand range.
Can ATM Forecasting Account for Denomination Demand?
Yes. Where denomination-level transaction and cassette data are available, forecasts can estimate how quickly individual notes are likely to be dispensed. This supports cassette planning and reduces the risk of one denomination running out while cash remains in the ATM.
Who Should Review ATM Forecast Exceptions?
Responsibility usually sits with treasury, cash management or ATM operations. The reviewer should understand current network conditions, record any override, and confirm the revised recommendation reaches order and fulfilment teams before the service deadline.
How Do You Separate Forecast Error From Replenishment Failure?
Compare forecast demand with actual withdrawals, then compare the recommended load with the amount ordered and delivered. This identifies whether the variance came from the model, order preparation, scheduling, or replenishment execution.